
What the forecast expects
Where the forecast is sharpest
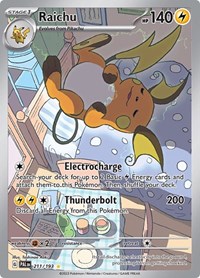
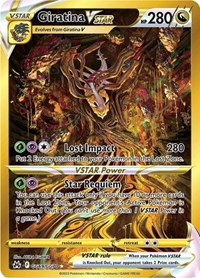
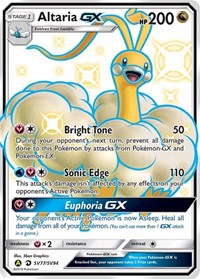
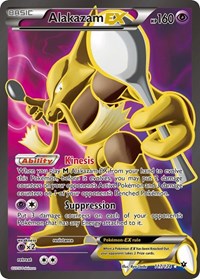
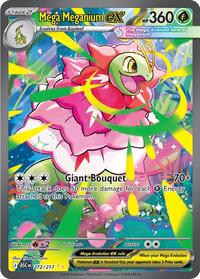
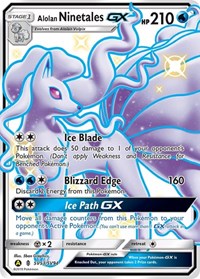
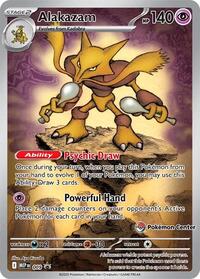
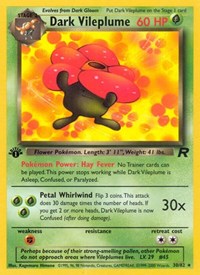
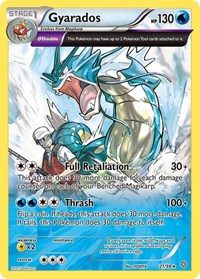
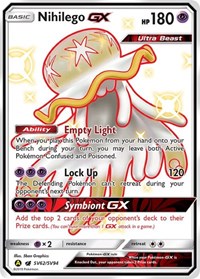
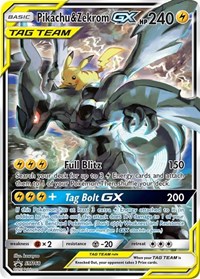
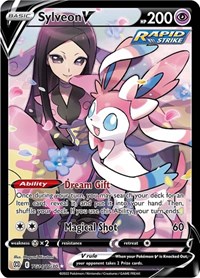
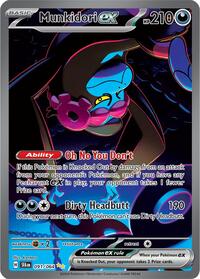
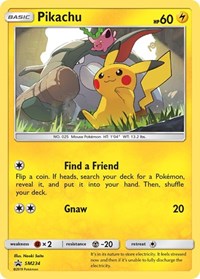
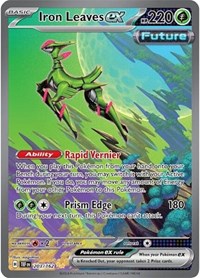
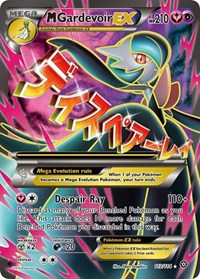
The model's tightest, best-grounded outcome ranges. Compare each card's market direction alongside its forecast precision.
533 cards answer this today







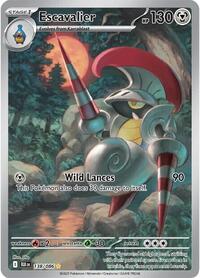
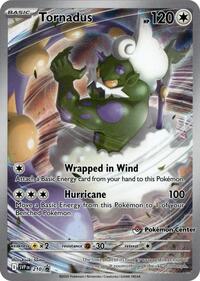
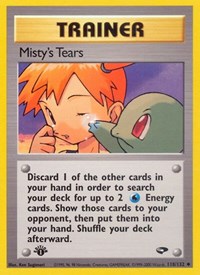
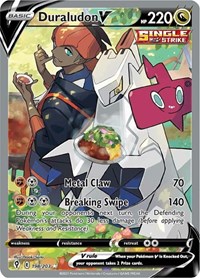

Why ask this
Not the best cards — the best-understood ones. These are the forecasts with the narrowest ranges, where the model can actually pin an outcome down instead of shrugging inside a 40%-wide band.
How to read the figure
The figure is the width of the 80% range as a share of the card's own price. Narrower is sharper. The typical card in this platform sits near 38%.
Shown on every row: Forecast range width
Where it can be wrong
Precision is not optimism, and confusing the two is the single most tempting mistake this data offers: forecast confidence rank-correlates about -0.99 with volatility, and its top quartile has the *lowest* typical chance of beating the market. Most cards here are likely to fall behind it.